Solar electricity generated from 5 Dec 2011 to 31 Dec 2021: 255,352 kWh (units)
Forecast annual generation: 26,548 kWh per year – enough for 6.1 homes (GB average)
Actual generation each year
2021: 26,433 kWh – highest in day: 195.5 kWh (25 April)
2020: 28,411 kWh – highest in day: 180.7 kWh (1 June)
2019: 28,014 kWh – highest in day: 181.9 kWh (22 June)
2018: 27,474 kWh – highest in day: 185.2 kWh (6 June)
2017: 26,749 kWh* – highest in day: 184.5 kWh (2 July)
2016: 28,270 kWh – highest in day: 188.1 kWh (29 May)
2015: 28,585 kWh – highest in day: 196.5 kWh (7 June)
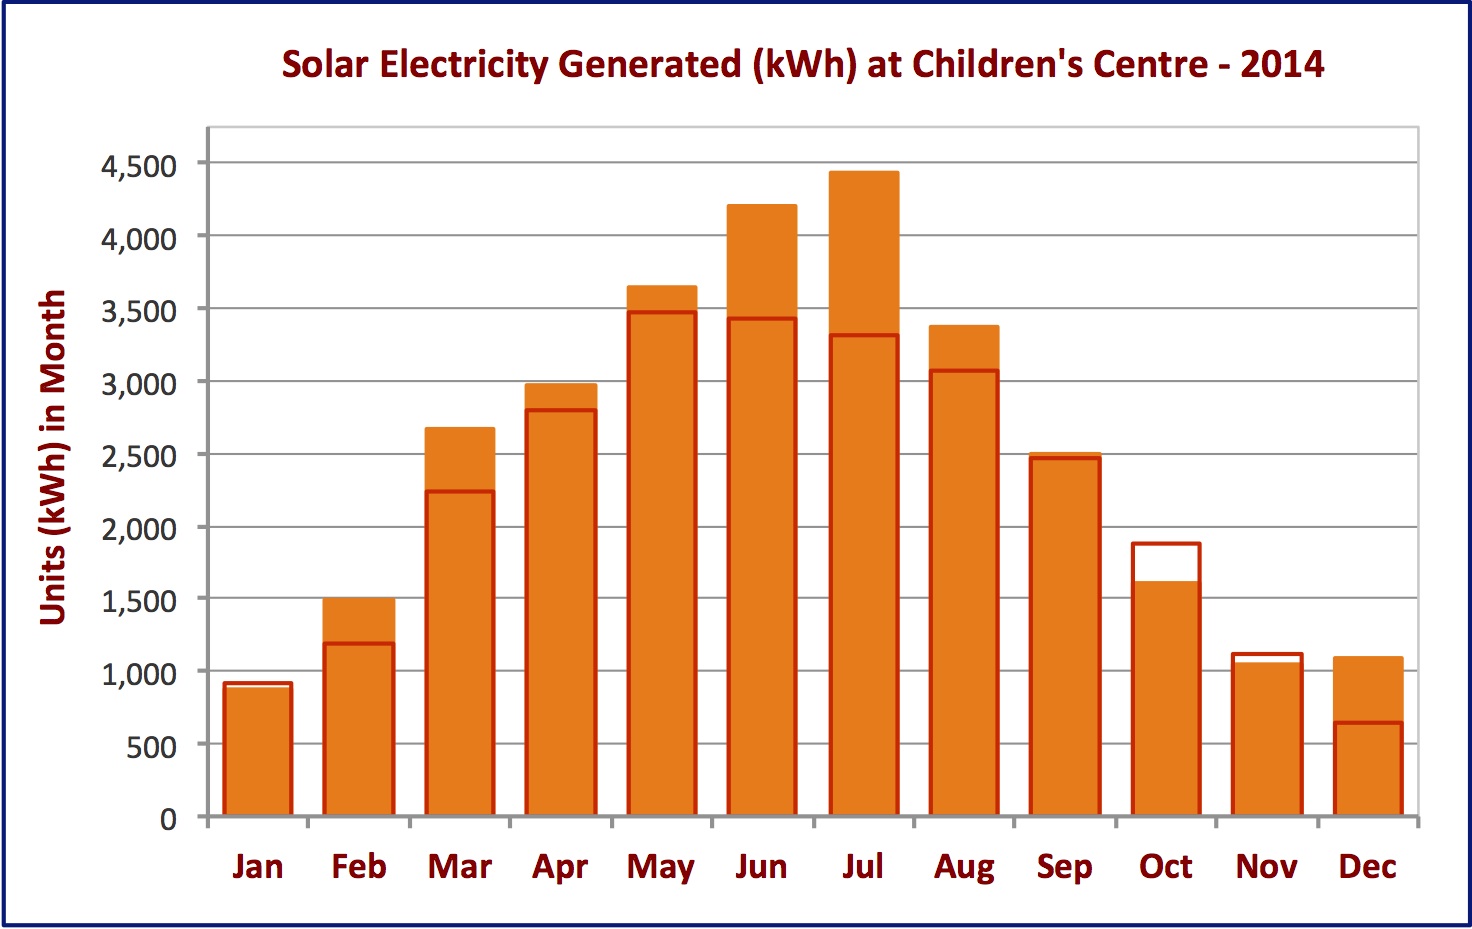
2014: 29,925 kWh – highest in day: 190.1 kWh (14 June)
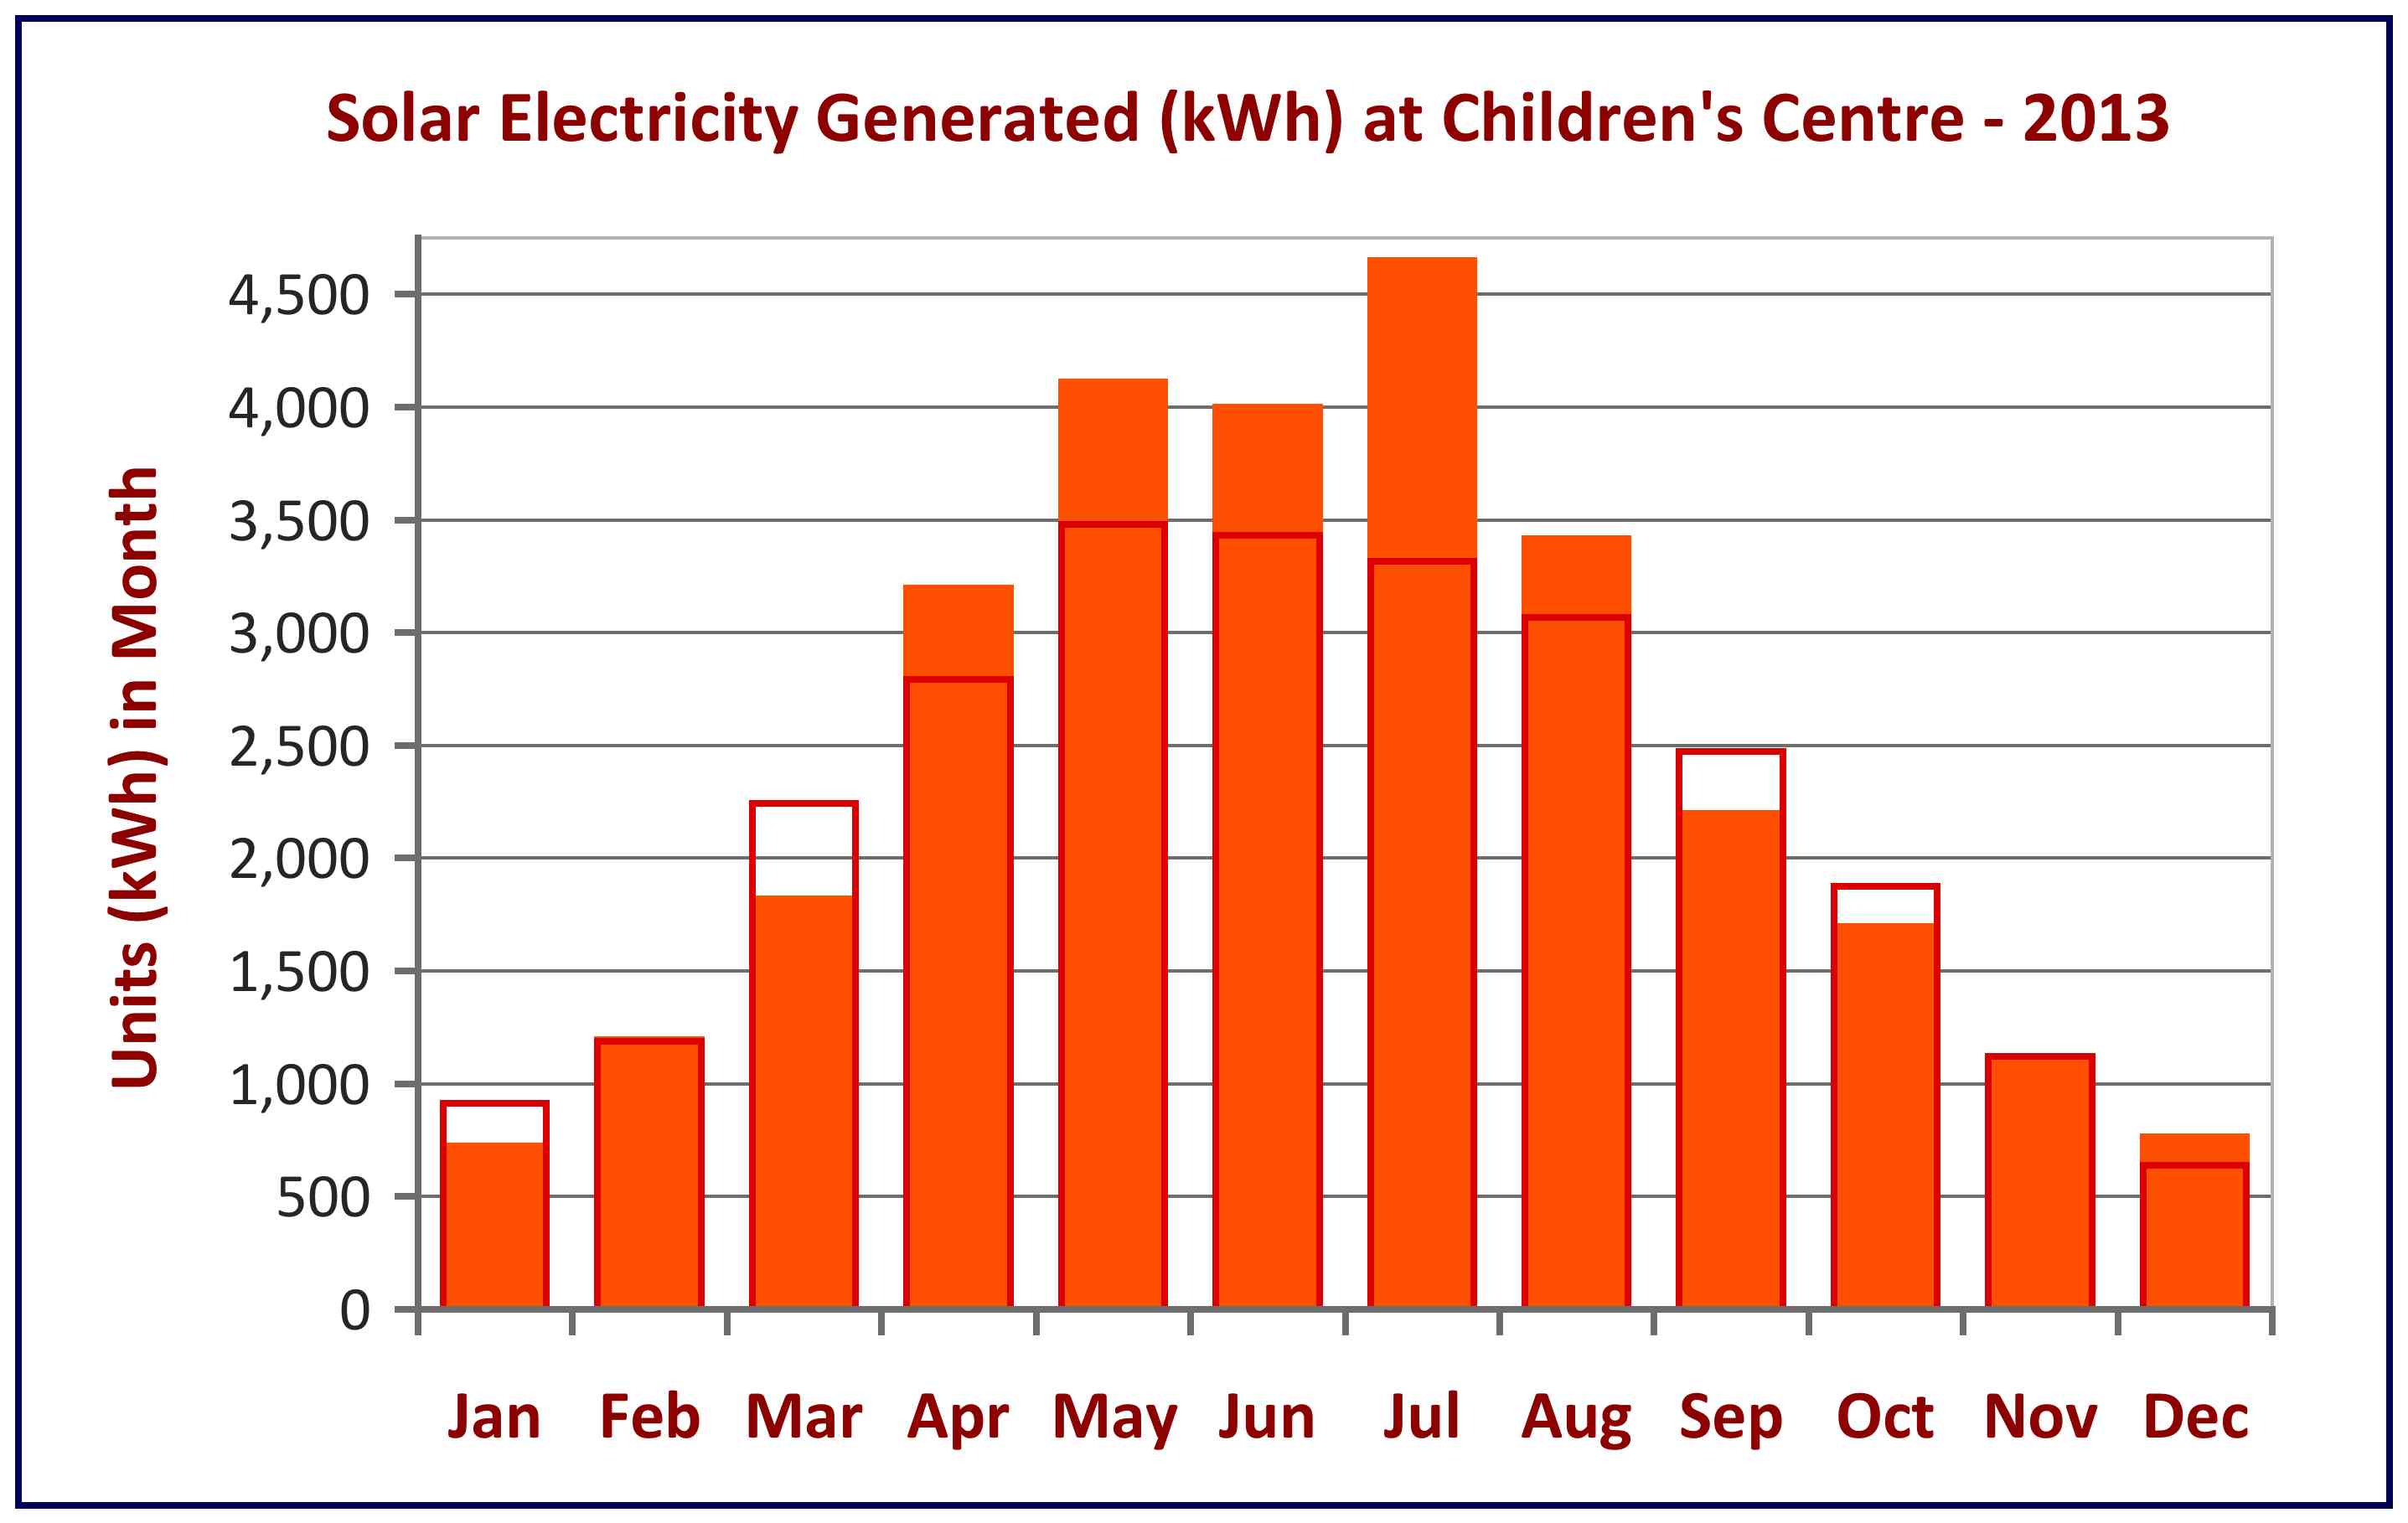
2013: 28,878 kWh – highest in day: 203.2 kWh (8 June)
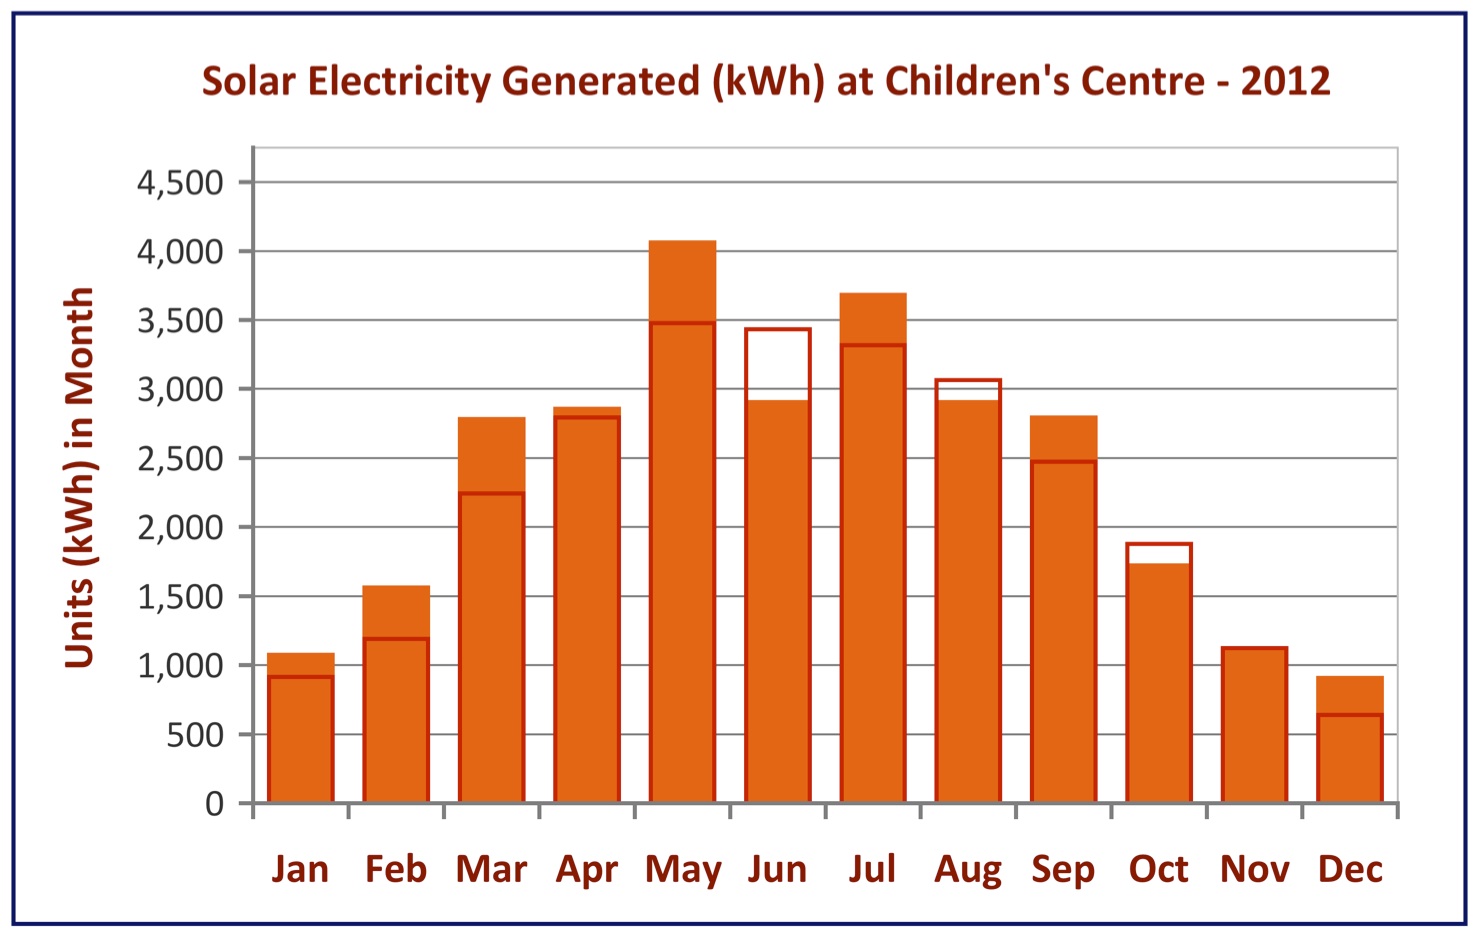
2012: 28,376 kWh – highest in day: 199.3 kWh (15 May)
* Some generation lost in November 2017 due to panels being switched off while electrical works undertaken at nursery.
The charts below show solar generation each month (solid orange columns). 2014 has been the best year for solar generation, with performance above forecast (red outlines) most months. 2015 was the best first half of the year, with solar output in April 2015 in particularly well above forecast. Performance is very slowly trending downwards each year, as expected, but the weather has a big effect on generation each year too.
Selected daily performance charts can also be viewed below, which show output during the day and with changing cloud cover, as well as for the best generation days we have recorded.


Daily Performance of Children’s Centre Solar Panels
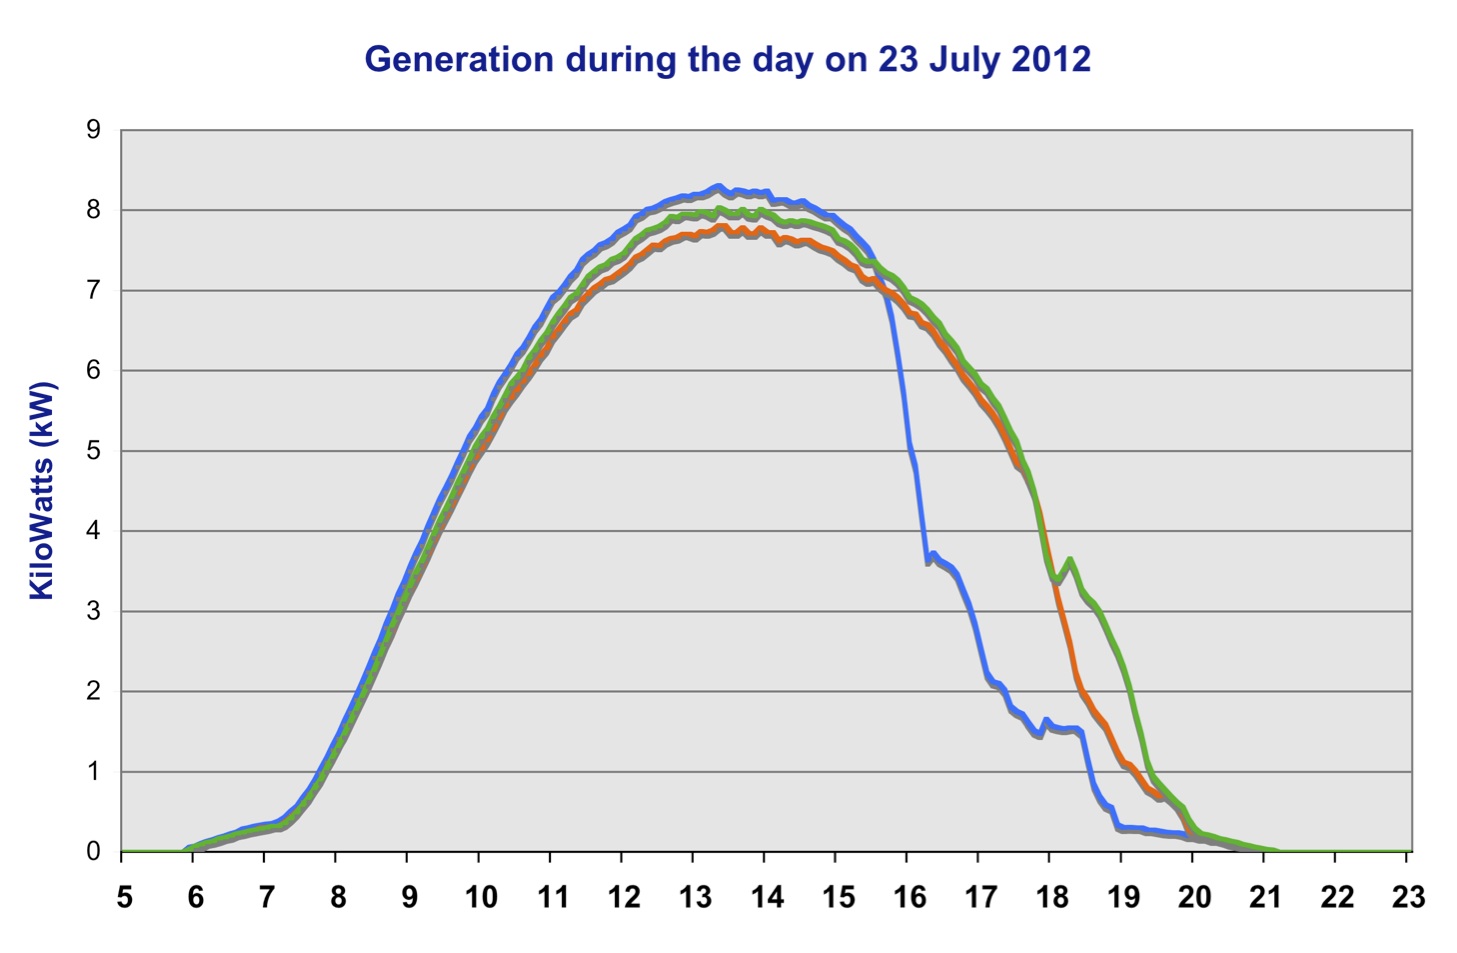
The chart below shows electricity generation on one of our best days so far in July 2012, when 191 units (kWh) were generated in a single day. The three lines show the power recorded through each of the three inverters, which are fed from three sets of panels on the roof. Generation started at about 6am and continued to 9pm (21:00).
It can be noticed that the inverter with the blue line has a reduced power output during the afternoon, as does the orange line inverter to a lesser extent. This is due to late afternoon shading from a tree alongside the centre, but the effect is more minor than might be suggested, as this chart shows output on a very sunny day when the shading loss would be at it’s greatest. The shading does not occur throughout the year and on cloudy days the loss is reduced as the daylight is more scattered and shadows less strong. Over the year, we estimate the total loss as being 300-500 units. Overall the performance of the panels is above forecast and the minor shading, which was expected, is not a cause for concern.
The charts below show other interesting daily outputs – click to view as a slideshow of full size images with captions.


